There is a demand for more state-of-the-art methods for effective analysis because data is generated from various information types, including phenotypes, morphological information, and spatial information. In immuno-oncology, finding the right biomarker is crucial to finding the right patients. Alice Gosselin, a Digital Pathology Data Scientist at Sanofi, explained that her work aims to provide an analysis pipeline where dimension reduction and clustering stratify patients using images of their tumour microenvironment.
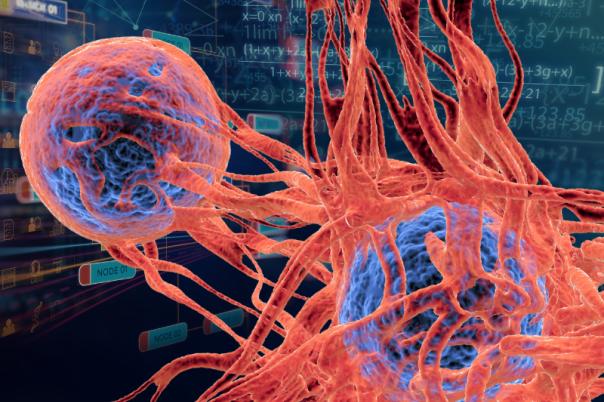
Sanofi’s digital pathology work gathers data from IMMUcan (Integrated iMMUnoprofiling of large adaptive CANcer patient cohorts) that seeks to understand the immune system in the tumour microenvironment and patient responses to treatment. The image analysis was conducted from biopsies of patients with advanced non-small cell lung cancer. Gosselin added that she specifically focused on imaging mass flow cytometry which has a large panel of biomarkers and very good precision.
Dimension reduction using autoencoders removed anomalies and redundancies in the data. Gosselin mentioned that her team also used graph photo encoders to integrate spatial information because they are very efficient and only rely on conventional network and graph data structure as input. However, they require high computational complexity which can be a hurdle when handling thousands of cells.
Three methods were used for the first part of data analysis: the classic approach, the classical spatial, and the spatial attention. The classic approach uses fully connected layers in the encoder and decoder parts. The classical spatial follows a similar approach to the classical one but adds distance calculations to three subpopulations of interest (tumour, stroma, and B cells) to the input of the autoencoder. Spatial attention focuses on spatial information by combining cell information with information from the populations of interest.
The second part of the analysis centred on clustering methods. Three techniques were used: classic Kmeans, phenographs, and spatialsort. The classic Kmeans is a centroid-based clustering algorithm. Phenographs use the nearest neighbour graph to uncover cell clusters based on marker expression. Spatialsort relies on Hidden Markov Random Field and allows the integration of spatial and prior information to understand interactions within the tumour microenvironment.
The clustering identified major cell populations such as T cells, B cells, and stroma cells. Furthermore, the methods revealed specific tumour microenvironment interactions. One cluster showed high CD8 and Granzyme B, while another displayed high expression of FoxP3 and ICOS, indicating a possible immunoresistant region. Gosselin commented: “So we see that this the interaction of these two markers may be interesting to target for therapies because of this immunoresistance.”
Integrating spatial information into imaging analysis enables better population identification and comprehension of interactions between cell types. Ultimately, this could help develop a deeper understanding of patient response to immunotherapies.
